
Microsoft Power BI: Data Aanalysis y Visualization for your Business
Improve business decision making
Microsoft Power BI is a data analysis service that provides interactive visualizations, maximizing the capabilities of Business Intelligence (BI) for your business.
The tool has a simple and highly intuitive interface that makes it easy for any user to take advantage of its extensive functionality by creating their own reports and dashboards, which will be easily shared and accessible among all departments that need it.

What is Business Intelligence?
The term Business Intelligence (BI), also known as Enterprise, Business or Commercial Intelligence, defines the set of technologies (including applications, products, technical architectures and strategies) focused on the administration and management of business-related data.
A technology that optimizes and facilitates decision making, helping to visualize and better understand the operation of the company, as well as to establish business forecasts with a greater probability of success. In order to make the most of this strategic factor and thus generate competitive advantages for your business, it is vital to have an updated data source and a system that helps its correct interpretation and visualization.
Thus, its connectivity to multiple data sources both local and in the cloud is one of the main values of Power BI, allowing you to access data from CRM solutions such as Dynamics 365 or Salesforce, Excel tables, Azure data or online databases.
The BI ecosystem
But Power BI is much more than just a data visualization engine. It is a complete ecosystem with multiple applications that complement and enhance its functionality. Of these, the three main components commonly used by all types of companies are Desktop, Service and Mobile.
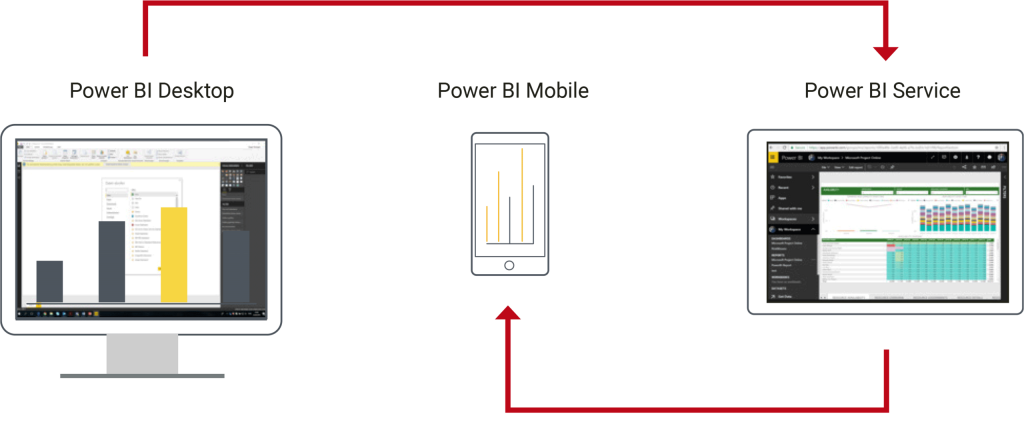
Power BI Desktop Service Mobile
– Power BI Desktop: is the desktop application for designing and publishing reports for Service, as well as creating integrations with data sets and their respective visualizations.
– Power BI Service: is the online service based on SaaS (abbreviation of Software As A Service), with a similar functionality to the desktop application but in which you can also consult the different reports that other members of your organization have prepared, as well as configure the automatic data update to have updated data available at all times.
– Power BI Mobile Apps: are the different mobile applications available for each of the main operating systems of devices, phones and tablets (Windows, iOS and Android), with which to view reports in real time by automatically updating data changes.
In addition to these three components, Microsoft Power BI makes available to users other tools such as:
– Gateways: these are gateways needed to synchronize and update the different external data inside and outside Power BI.
– Embedded: the REST API used to create dashboards and reports in custom applications.
– Report Server: is the reporting solution for on-premise Power BI for companies that do not store data in the cloud.
– Visuals Marketplace: where to find visual objects focused on statistical analysis.
Data analysis
A powerful data visualization system is one of the best possible ways to detect opportunities and trends for your business. Being able to have a global view or to interpret concrete data quickly and effectively is vital for decision making. Power BI allows users to filter and sort that data according to their specific needs, so they can better drill down into that data to gain new insights, a better understanding of their customers’ behavior, and new and more efficient ways to reach them.
When it comes to enterprise-level data analysis, Power BI is an excellent tool because it provides great flexibility to extract relevant information from a wide range of sources for a wide range of industries as diverse as healthcare, IT, communications, economics, etc., allowing the development of customized reports and interactive data visualization. By combining, optimizing and transforming this data, it enables in-depth analysis and the emergence of relevant patterns for decision making.
In addition, as we saw earlier, being a multiplatform tool, it enables the creation of reports for mobile devices in real time, a process that runs with all the guarantees of security, since user authentication is done through Azure Active Directory.

Main benefits of Power BI
Its ability to connect to different data sources, from local files to online platforms, allows the crossing and analysis of data visualizing them in a single dashboard in a simple way, facilitating and speeding up its interpretation. Practically universal management and consultation, being able to load data from the main file formats (from simple text files to csv or Excel).
Its flexibility and scalability make possible its use by any business department, whether directed to production, logistics, human resources, accounting or any other area of activity to provide dashboards perfectly adapted to the structure of each department while allowing the fluid exchange of information between them. Moreover, being hosted in the cloud, the information is always instantly accessible, thus facilitating its sharing.
Thus, we can define the main benefits of implementing Microsoft Power BI as a data analysis and visualization tool:
– Power when performing advanced analysis to find patterns, optimize, debug, transform and combine data from different origins.
– Flexibility when adapting its use among the different departments of our business and sharing information between them.
– Ease of data preparation and modeling as well as data interpretation, thanks to interactive data visualizations.
– Accessibility at all times from different platforms.
– Customization when designing reports through the different tools for creating themes, formats and designs.
In short, Microsoft Power BI is a powerful tool that will allow us to focus on the tasks that are really relevant to our business. A safe, intuitive and, of course, agile way to obtain the best data analysis, facilitating collaboration between our different work environments to share reports in real time from any device. All the power of Business Intelligence to optimize decision making in our business.